Fastest Way To Read Large Excel Table In Power Automate

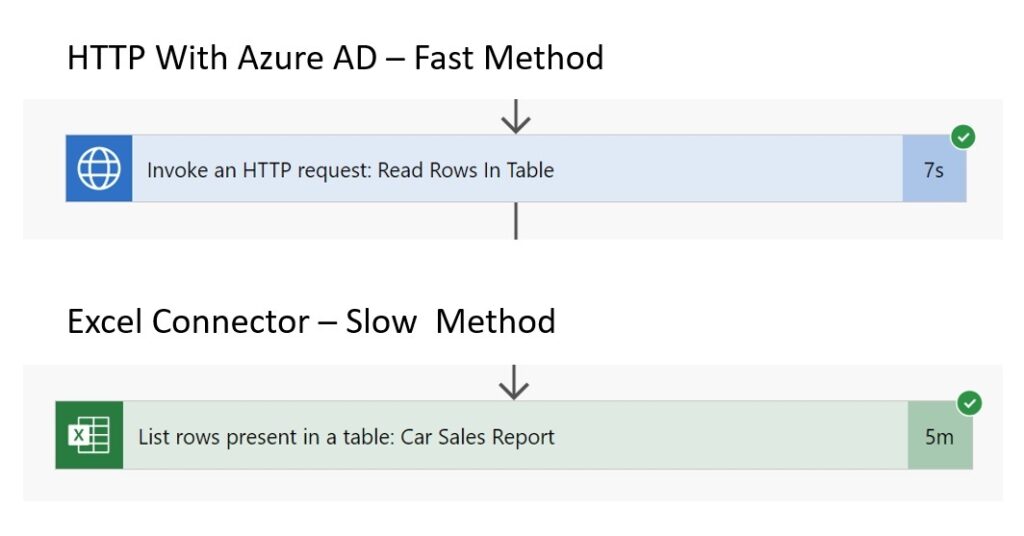
With this method I was able to get 50,000 rows from an Excel file in 7 seconds. By comparison, the Excel action built in Excel action is quite slow. It took over 5 minutes to get the same amount of rows. This is the quickest way to get all of the rows in an Excel table and it can handle up to 100,000 rows. You must learn this method if you want to build high-performance flows!
Introduction: The Car Sales Report
Each month car manufacturing company uses an automation to read the rows from a large Excel table and write them into an analytics database.
The Power Automate flow uses the HTTP With Azure AD – Invoke An HTTP Request action combined with the Microsoft Graph API to GET all rows to from an Excel table instead of the Excel connector.

Using the HTTP With Azure AD Connector the automation is able to fetch 50,000 rows in only 7 seconds. To contrast, the Excel connector built into Power Automate takes over 5 minutes to do the same actions.
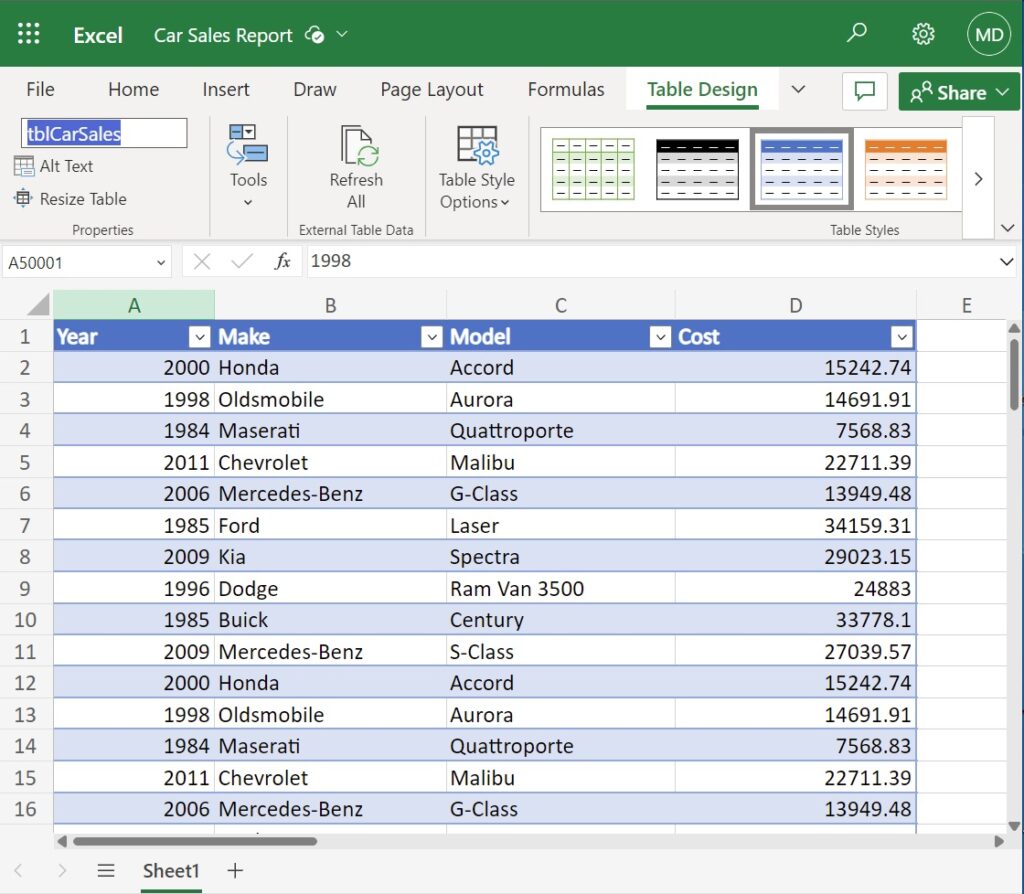
Create An Excel Table With 50,000 Rows
Open SharePoint and create a new Excel file named Car Sales Report.xlsx inside of a document library.

Then insert a new table object called tblCarSales into Sheet1. Include the following table columns:
- Year
- Make
- Model
- Cost

Use this sample data to populate the table.
| Year | Make | Model | Cost |
| 2000 | Honda | Accord | 15,242.74 |
| 1998 | Oldsmobile | Aurora | 14,691.91 |
| 1984 | Maserati | Quattroporte | 7,568.83 |
| 2011 | Chevrolet | Malibu | 22,711.39 |
| 2006 | Mercedes-Benz | G-Class | 13,949.48 |
| 1985 | Ford | Laser | 34,159.31 |
| 2009 | Kia | Spectra | 29,023.15 |
| 1996 | Dodge | Ram Van 3500 | 24,883 |
| 1985 | Buick | Century | 33,778.10 |
| 2009 | Mercedes-Benz | S-Class | 27,039.57 |
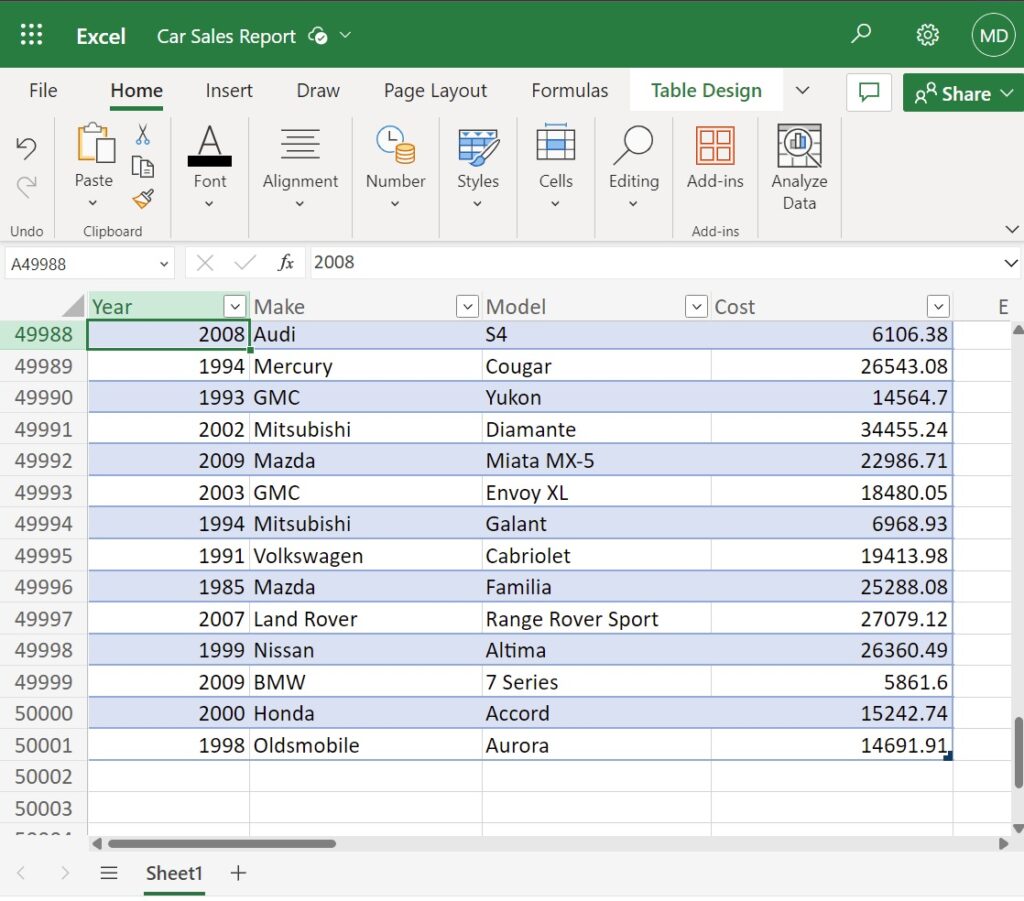
There are only 10 lines in the sample data but it can be copied into the spreadsheet as many times as desired to simulate a large data set. The example we are doing here together has 50,000 rows.
Get The Drive ID & Item ID From The Excel File
We need to get the Excel workbook’s Drive ID and Item ID to use in the Microsoft Graph API call. To find these IDs return to Power Automate and insert the Excel for Business (Online) – List Rows Present In A Table action into the flow. Choose the Excel table named tblCarSales from the Car Sales Report.xlsx spreadsheet.
Set the Top Count field to 1. We don’t need to get the rows from this spreadsheet We only want to get the information about where the table is located from the action.
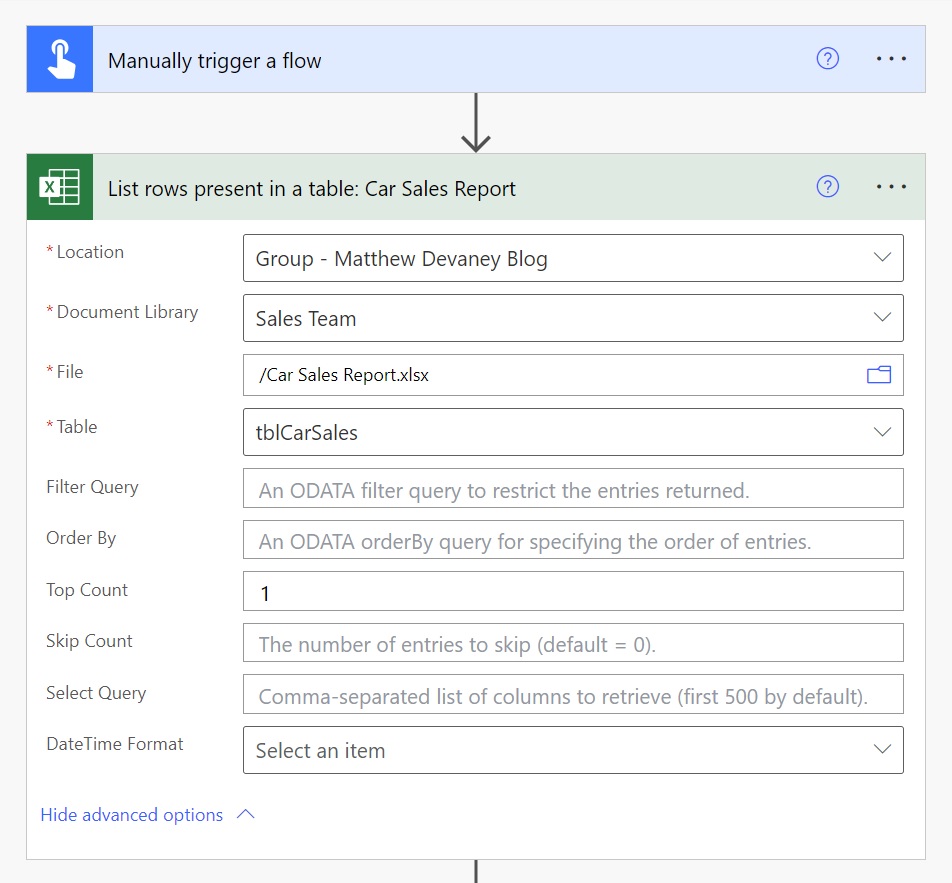
After the flow is run the Drive ID (“drive”) and Item ID (“file”) can be found in the action’s inputs.

Next, create a set of two Data Operations – Compose actions named Compose: Drive ID and Compose: Item ID.
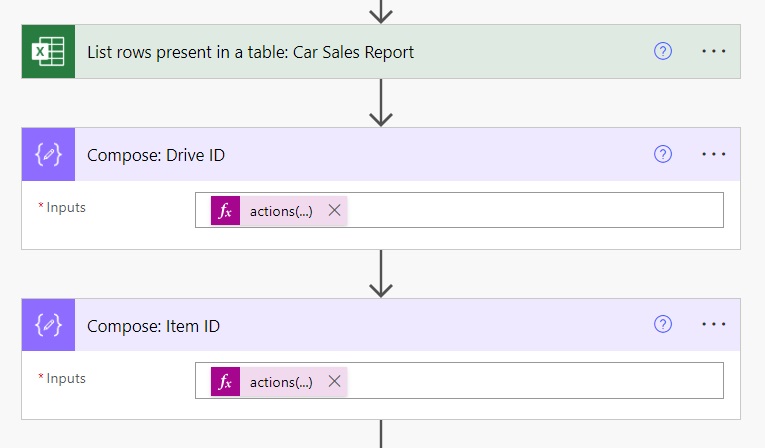
Get the Drive ID using this Power Automate expression.
actions('List_rows_present_in_a_table:_Car_Sales_Report')?['inputs']?['parameters']?['drive']Code language: JavaScript (javascript)
And get the Item ID using this Power Automate expression.
actions('List_rows_present_in_a_table:_Car_Sales_Report')?['inputs']?['parameters']?['file']Code language: JavaScript (javascript)
Configure A Connection To Microsoft Graph
The Microsoft Graph API provides access to Microsoft 365 data and services, such as allowing developers to programmatically interact with Excel files stored in SharePoint. We can access it using the HTTP With Azure AD connector. Add the HTTP With Azure AD – Invoke An HTTP Request action to the flow.
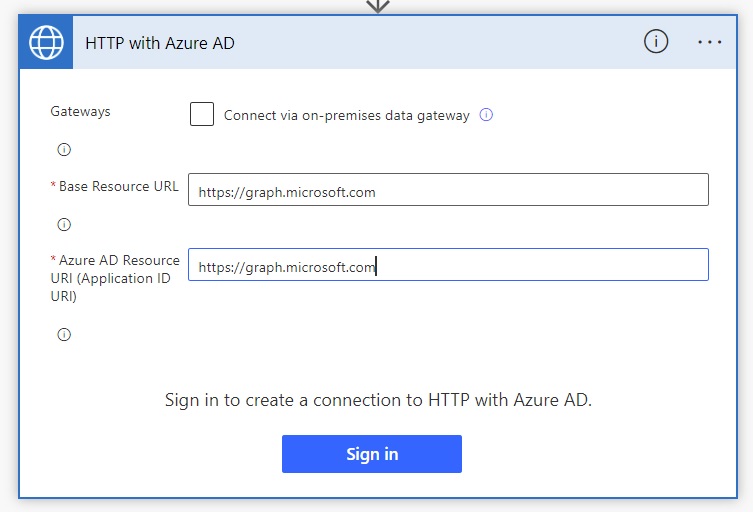
Use this URL for both the Base Resource URL and Azure AD Resource URI fields when configuring the connection.
https://graph.microsoft.comCode language: JavaScript (javascript)
Read The Rows From An Excel Table Using HTTP With Azure AD
Now that we are connected to the MS Graph we can use the Create Table Row endpoint for Excel workbooks endpoint to get all of the rows from a table. Select the GET HTTP method to indicate a resource is being read.
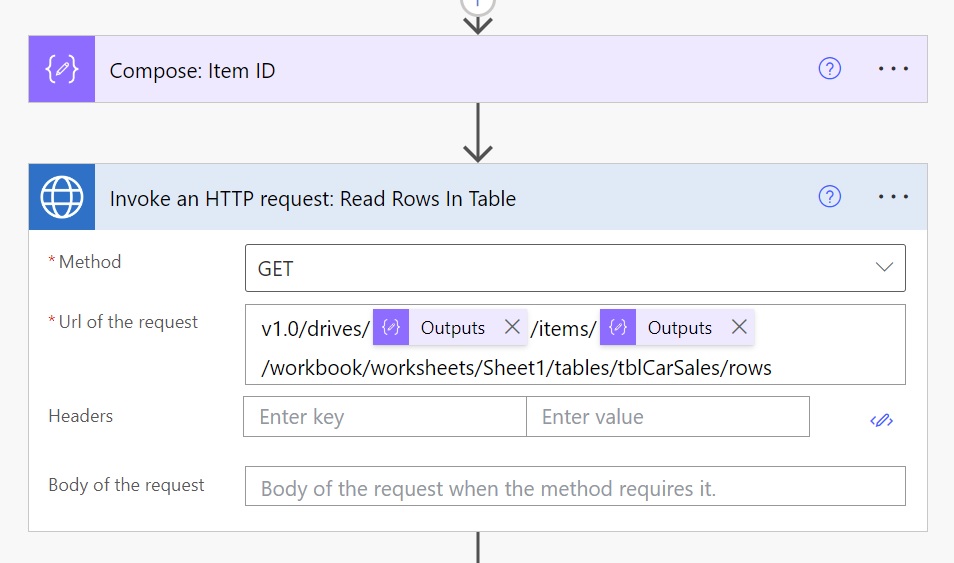
Use this code in the Url of the request.
v1.0/drives/@{outputs('Compose:_Drive_ID')}/items/@{outputs('Compose:_Item_ID')}/workbook/worksheets/Sheet1/tables/tblCarSales/rowsCode language: JavaScript (javascript)
Transform The Response Into A Flattened Array Of Excel Rows
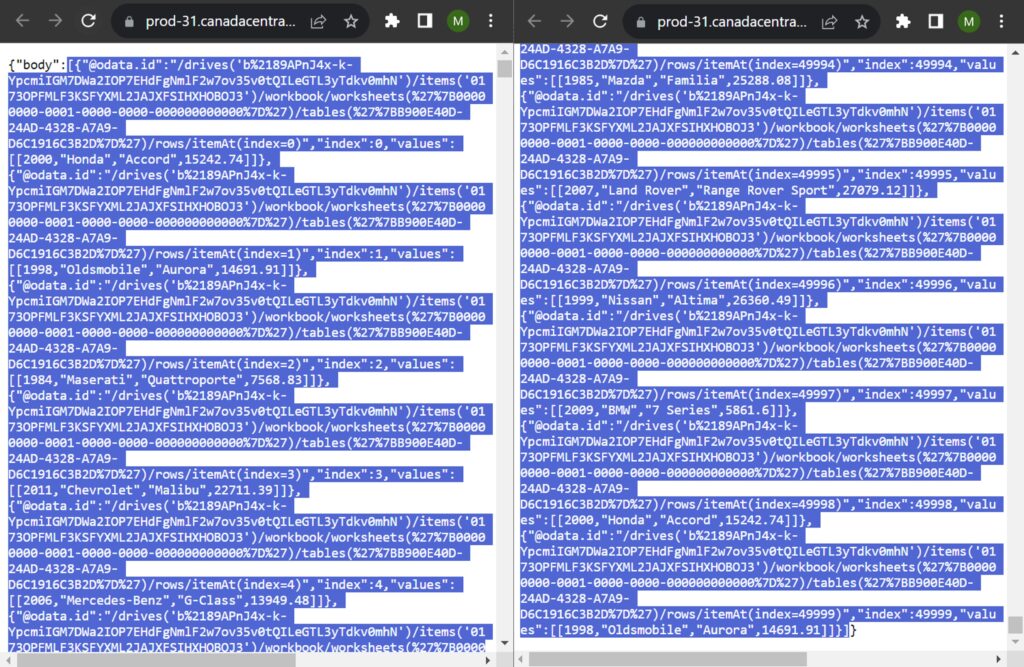
The Graph API call responds with a JSON containing all of the Excel table rows. But we must do some additional transformations of the JSON to get the data into a useable state. Add a Data Operations – Parse JSON action to the flow.
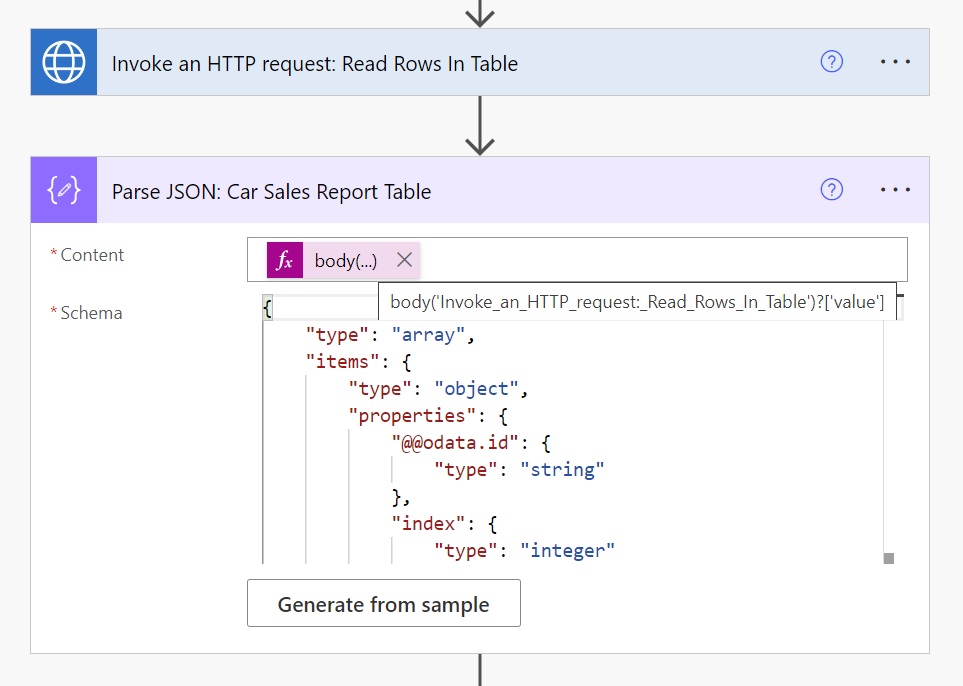
Then use this code in the Content property of the action.
body('Invoke_an_HTTP_request:_Read_Rows_In_Table')?['value']Code language: JavaScript (javascript)
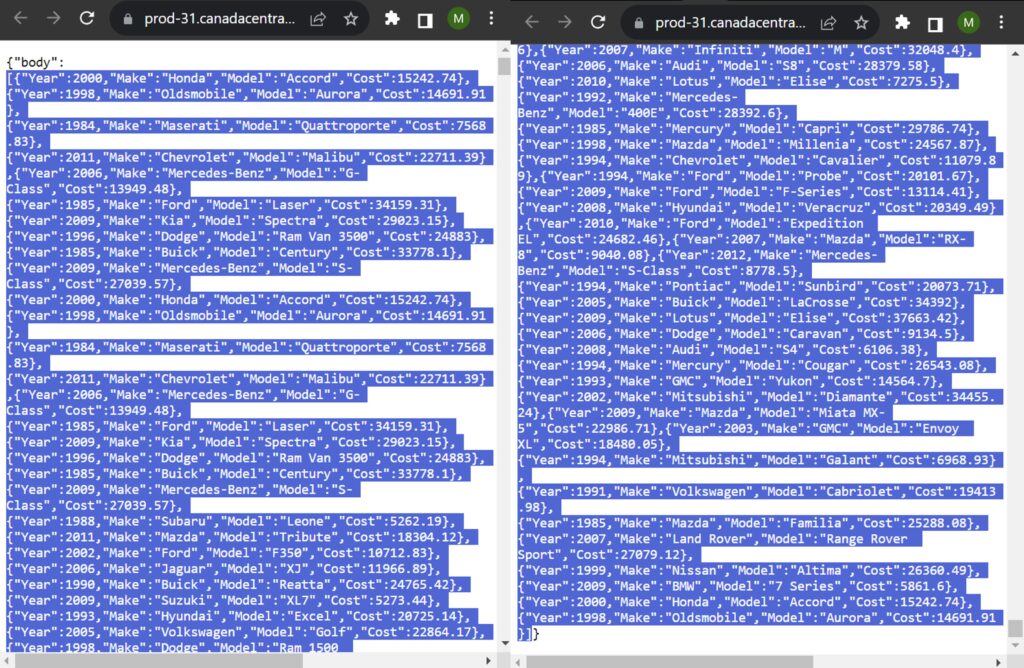
Run a test of the flow to see what the JSON response looks like from the Invoke an HTTP Request – Read Rows In Table action. Highlight and copy the array in the body property of the JSON. Then use the Generate from sample feature and paste the array into the input box. The JSON schema should appear exactly as in the image above.
Next, add a Data Operations – Select action to the flow and switch the Map property to text mode.
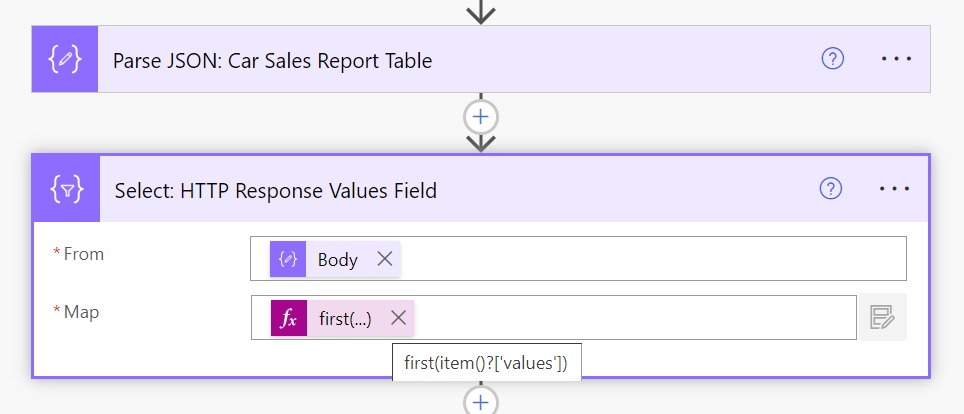
Then use this code in the Map property.
first(item()?['values'])Code language: CSS (css)
Finally, insert another Data Operations – Select action and use it to define column names and create an array of records.
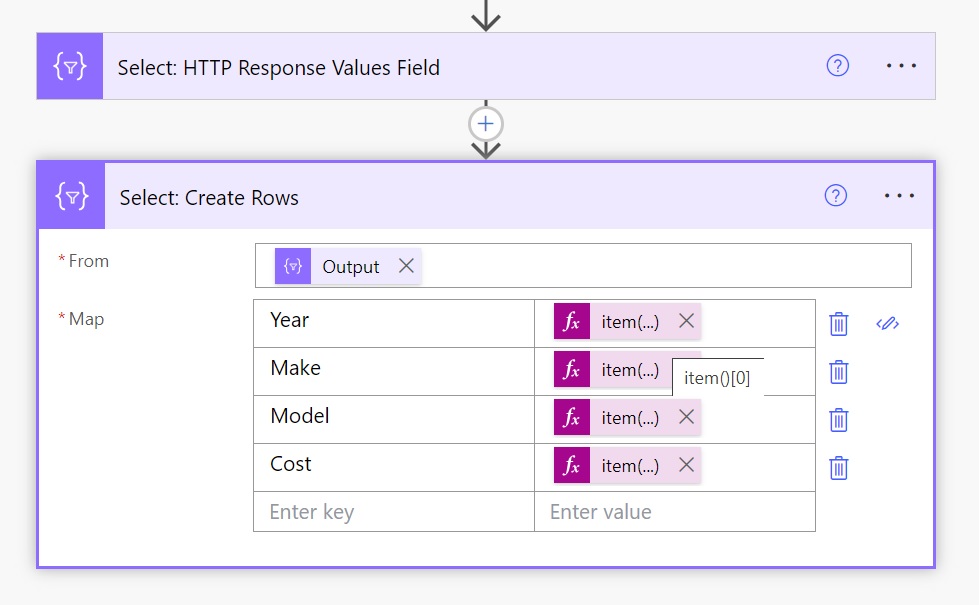
Year column value expression:
item()[0]Code language: CSS (css)
Make column value expression:
item()[1]Code language: CSS (css)
Model column value expression:
item()[2]Code language: CSS (css)
Cost column value expression:
item()[3]Code language: CSS (css)
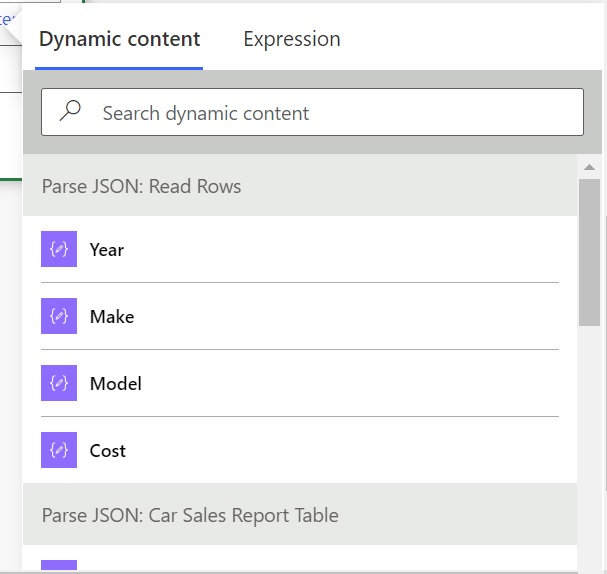
Parse The JSON Array Into A Set Of Dynamic Values
We could directly reference the values in the Select: Create Rows action but it will be easier if we generate values that appear in dynamic content menu. Add a Data Operations – Parse JSON action and add it to the flow. Use the output of the Select: Create Rows action in the Content property.
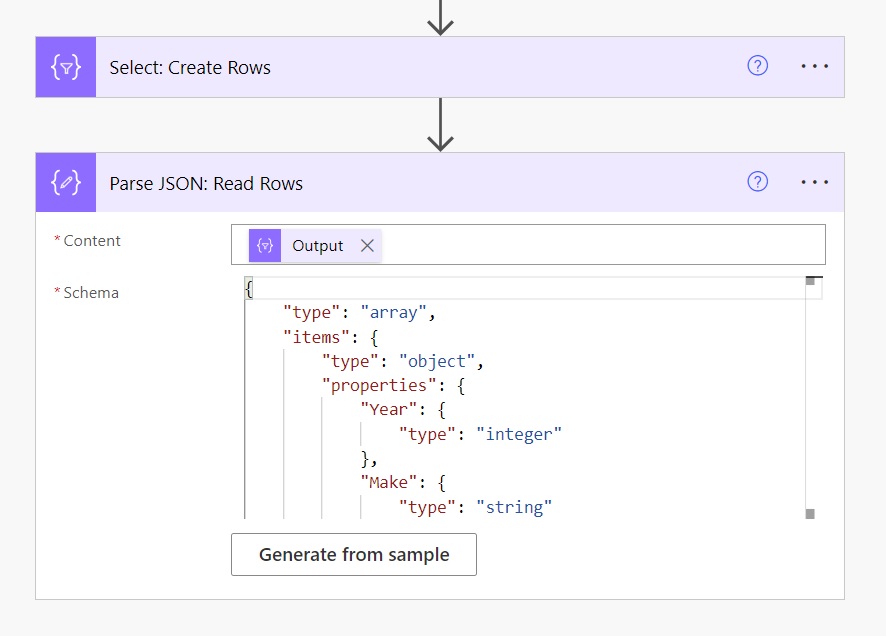
Run a test of the flow to see what the JSON response looks like from the Select: Create Rows action. Highlight and copy the array in the body property of the JSON. Then use the Generate from sample feature and paste the array into the input box. The JSON schema should appear exactly as in the image above.
Now the Excel table column names appear in the Dynamic Content box.
Run The Power Automate Flow To Read Rows From An Excel Table
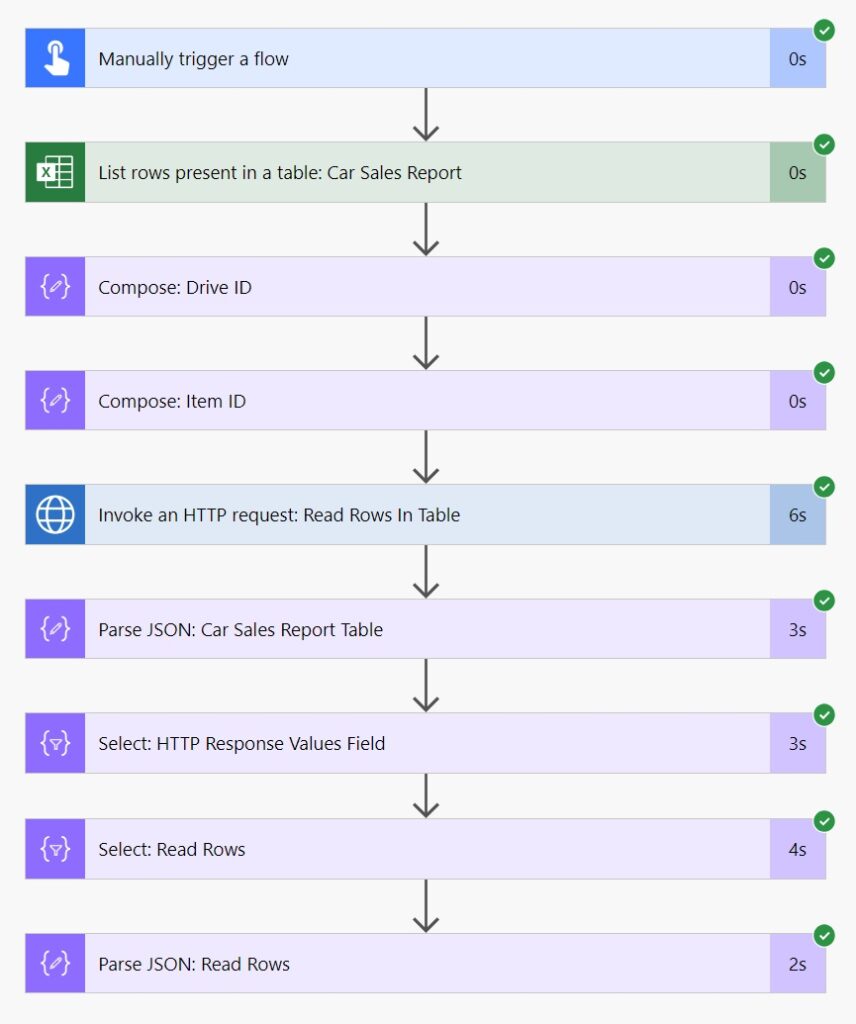
We have now finished building the flow. Give the flow a test run to see how fast it completes the actions. The example below read 50,000 rows in 18s.
Did You Enjoy This Article? 😺
Subscribe to get new Copilot Studio articles sent to your inbox each week for FREE
Questions?
If you have any questions or feedback about Fastest Way To Read Large Excel Table In Power Automate please leave a message in the comments section below. You can post using your email address and are not required to create an account to join the discussion.


Is there any issue/limitation with the Graph API?
Previously one of our customer’s security team denied access to the graph API as using Graph API, we can also use other end points to retrieve AD details and query all the user’s details in the Org, and this was a privacy concern for them.
Vikras,
The big issue is granted access to Graph gives permissions to all of its endpoints. Including some that you may not wish to grant (security, user data, etc.). Connector endpoint filtering has been added to DLP but it’s not available for HTTP With Azure yet…
Connector endpoint filtering (preview)
https://learn.microsoft.com/en-us/power-platform/admin/connector-endpoint-filtering
wow, interesting approach and method – Thank you!
ps – I would not mind if you feel like creating another blog/tutorial by extending that concept with an add/update of these dynamic values and rows to a Sharepoint List:-)
Kay,
Can you please explain what is meant by dynamic values and rows?
Hello Matthew, taking advantage of my friend’s question and taking the opportunity to thank you for your content, I’m a big fan!
It would be interesting to read the Excel data as you did above and use the graph to write these items into a SharePoint list. I believe this is the friend’s question above and it is something I would like to know how to do too.
Thank you in advance and congratulations again on the content!
Tiago,
I’m curious. What is the motivation to use Graph for writing them to a SharePoint list? As you know, there are already built in actions to write to SharePoint.
Hi Matthew,
Yes, I know we have built in actions to write to SharePoint, but as you showed, using the graph is much faster than using the native Excel connector
I’ve worked on some projects where people updated Excel and it always had to be uploaded to a SharePoint list (For use in power apps, for example) and depending on the number of rows, this took a considerable amount of time.
It’s just an idea to check if the graph saves time using Sharepoint as you showed us there using Excel
Thanks 🙂
Tiago,
Thank you for helping me to understand your reason for wanting to do it.
Yes, there are ways to batch the Graph API calls that increase speed of record creation and use less calls toward the connector limits.
Check out this article by my friend Paul Murana:
https://www.tachytelic.net/2021/06/power-automate-flow-batch-create-sharepoint-list-items/?amp
Sadly I work with a company that uses excel as data sources. I am trying to change that mindset, but one reason they do use excel is because they are hesitant to put hooks directly into SAP. Either way, they have a daily job that dumps a massive employee data file that contains training and qualification data. I have an app that needs to lookup some certification data and I use this file that resides in SharePoint. My issue with the flow is the file ID (a guid) changes every day. The file does not come through with a table so I have a power automate that creates the table. When an employee is selected in the app, it calls a power automate workflow that sends the employee ID and then needs to filter and return the certification data just for that employee. All works wonderfully, but the issue is that I need to go in every morning and amend the power automate to find the new excel file that was produced and point to the new “table1”. I dont want to have to go in and change that every morning. If that part could be fully automated then I would be good to go. Do you have any idea or recommendations?
Brad,
You can use the standard Excel – List Tables action to get all of the Table Name and GUID pairings in the targeted Excel file. Filter the pairings by the name Table1 and then you’ll have your GUID. No more manual work 🙂
that works great! thank you!
Hi Matthew, I am looking for a way to combine Excel files (basically put all worksheets in one workbook, while preserving formatting, cover images or tables).
I have created some flows but only using ENCODIAN I have the required results:
1. using a premium connector (ENCODIAN) works fine but I am looking for something free because of a budget issue.
2. Using the Office Scripts worksheet merge method but I can’t seem to copy the format of my worksheets so I can actually use it (This is an invoice process so it needs the format selected for each client).
3. I tried using Microsoft Graph to get a consolidated excel (which I manually build with all my invoice types) and using DELETE WORKSHEET to keep only the specific worksheets I need.(I can’t get it to work yet).
If you have any advice for this I would be very grateful. Thanks in advance for sharing.
Rodrigo,
If this automation will only be used by yourself just grab the free version of Power Automate desktop and use it instead of all those other options. It is the most simple.
I get output for Drive id and Item id. But get error invalidRequest at Invoke an HTTP Request action.I copied Url of the request exactly from yours. Replaced Drive Id, Item Id and Sheet name.
v1.0/drives/@{outputs(‘Compose:_Drive_ID’)}/items/@{outputs(‘Compose:_Item_ID’)}/workbook/worksheets/Sheet2/tables/CorsearchTM/rows
{
“error”: {
“code”: “invalidRequest”,
“message”: “Invalid request”,
“innerError”: {
“date”: “2023-10-18T05:50:10”,
“request-id”: “928ddf5d-38fb-4c84-8e3b-8c5525802065”,
“client-request-id”: “928ddf5d-38fb-4c84-8e3b-8c5525802065”
}
}
}
Please verify the URI value being passed for Invoke an http action in the run result. It should have id’s at both drive, file id places, not names.
Hello, I have a question about this.
I’m connecting with the office 365 groups connector from the graph API power apps.
I managed to import the items in the Sharepoint list, but I can’t show them in Gallery either.
Set(
varList2;
Office365Grupları.HttpRequest(
“https://graph.microsoft.com/v1.0/sites/****.sharepoint.com,id/lists”;
“GET”;
“”
)
)
would you like to publish a study on this topic
thank you for your work in advance.
Yılmaz,
The HttpRequest action for this connector is being deprecated. It works, but I suggest you do not use this for future-proofing purposes.
Hey Matt,
This doesn’t work when a file is selected dynamically like when using a trigger “When a file created”. When I select “Identifier” dynamic property to choose the file, in that case the file property comes as something of this format which is quite different from what you have in your example. When a file is selected manually it works perfectly fine.
“file”: “LMS%2bAutomation%252fCorsearch%2bTrademarks%252fAutoliv_ToSync_02.xlsx”
I found a way for this problem. I wish this helps someone else too.
The Thumbnail property from the trigger has the file id embedded. We can use expression decodeUriComponent(triggerOutputs()?[‘body/{Thumbnail}/Large’]) to get the readable string of the Thumbnail and do string operations to fetch the file Id. It is the text between “/items/” and “?version” of that string.
Hi Matthew,
Great content – as always, thank you!
I’ve tried to beat your result, without the Graph API.
The best I could achieve was 10 seconds to read an Excel table with 50000 rows and 4 columns!
It doesn’t offer any advantage to your method, except for the fact that it doesn’t require a Premium Connector, which I guess the HTTP request method does.
If you allow for a guest post, I’d be happy to share the flow here.
Anyway, thanks for this great content!
Nuno,
My guess is you used Office Scripts. Am I correct?
Exactly!
I’ve actually written a post on my blog about it.
Should you be interested, you may find it here.
Great tutorial, as always Matthew! I have little JSON knowledge and managed to replicate most of the steps, but got stuck at the end because I couldn’t get the schema correct. I switched over to Nuno’s solution, which worked but for me takes 50-60 seconds to run. Which isn’t horrific in reality, but causes a long wait time on the loading screen of my app (I want it to run to completion before the user is taken to the home page). after a long night and knowing little about JSON, I figured out how to get the json text to power app in 9 seconds all steps combined! No premium connectors and easy for a beginner.
Hello Math
This flow was surprising, but it doesn’t work for me, as it is a PREMIUM connector!
I was very sad because I had gained performance in my routine tasks.
Please let us know when the Flow is PREMIUM or not, this helps a lot when creating.
But thank you for your blog, it helped me a lot to grow!
Roni,
Sorry to hear that you are unable to use premium connectors.
I followed, and got error about “Configure A Connection To Microsoft Graph“, it said
Create and authorize OAuth connection failed. AADSTS500011
I got that same error. Did you figure out how to resolve this?
Hi again. Quick update. Per this blog – Solved: Re: HTTP with Microsoft Entra ID (Formerly Azure A… – Power Platform Community: I have a sorted this out, if anyone else having this problem, just go to Microsoft Entra ID Pre-Authorize and add new connection in it and add https://graph.microsoft.com in both text boxes i.e. (Base Resource and Entra ID), it will work like a charm.
Hi Matt,
Great article! I’m able to process files with 70K+ rows in under 20 seconds with this approach! I had one question – what is the proper syntax to use for the HTTP Connector for Excel sheets with spaces in their name (i.e. “Sheet 1” instead of “Sheet1”)?
I’ve tried an underscore _, _x0020_, and no space as replacements.
-Best,
E.J.
Hi Matt,
I figured it out – %20.
Still a great article! Thanks!
Hi Matt,
Thanks for this post, it helped me a lot. I now receive my data within a very short time. But data should now be saved in a Sharepoint list. With Create Item this takes forever.
Is there a faster way to save the read data in a SharePoint list? I try Send an HTTP Request to Sharepoint but that doesn’t work.
Freket,
Yes, you can batch update SharePoint list items using this method.
https://www.youtube.com/watch?v=2dV7fI4GUYU
This is a really helpful solution, especially the intermediate steps to prep the data. Very much appreciated!
really nice way of doing it !
Is it possible to do the “opposite” ? Like adding lot of row quickly in the excel table ?
Hi Matthew, the error I am getting is at the step: Select: HTTP Response Values Field
“BadRequest:
The ‘from’ property value in the ‘select’ action inputs is of type ‘Object’. The value must be an array.”
Please help me fix this!
NVM I figured it out. TY!
With respect to the Invoke an HTTP request: Read Rows In Table ACTION, can you append filters to the URL of the request?
Such as: $filter=startswith(displayName,’A’)